
Like a ball that bounces crazily off the walls of a pinball machine, investments move around the globe, quickly and without any point of reference.
They follow the movements of economies, while the sirens of the markets bring vitality and flessibility with the most efficient instruments to attract big investors, both private and public.
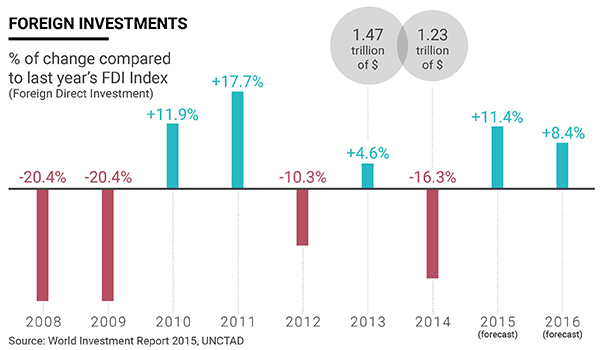
The 2015 World Investment Report published by UNCTAD (the United Nations Conference on Trade and Development) traces the flows of international capital across the map of the world. One of its first observations is that of a negative trend: foreign direct investment (FDI) in 2014 fell 16.3% from the previous year to an absolute value of $1.23 trillion.
The trend does not seem to worry UNCTAD’s analysts since they expect a return FDI to return to growth in the coming years. For 2015, they forecast it rising 11.4% and 8.4% the following year. This outlook comes after the world suffered a sharp drop in investment as a result of the financial crisis. In both 2008 and 2009, it tumbled 20.4%. FDI recovered in 2010, going up 11.9% and then by 17.7% in 2011. The trend it halted the following year, contracting by 10.3%.
China Overtakes
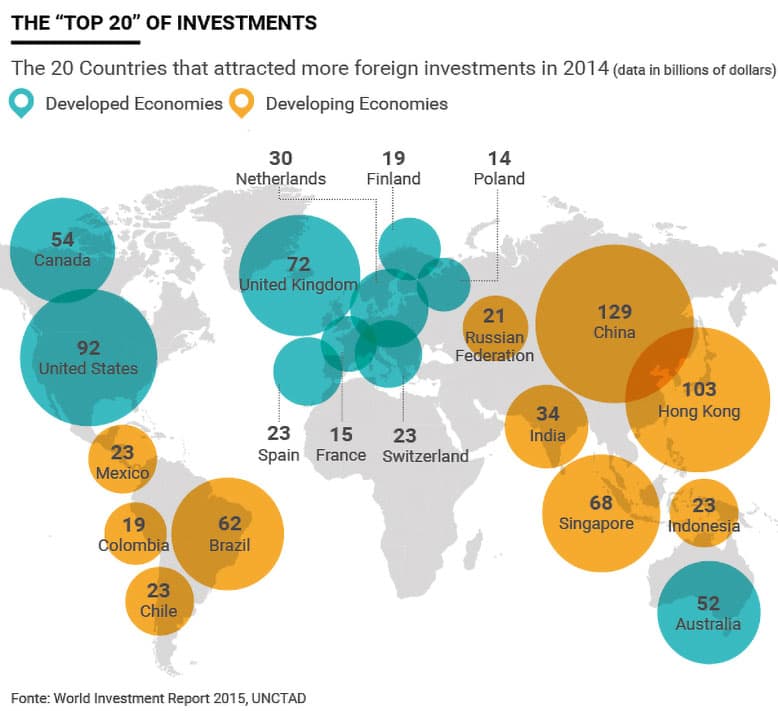
In 2014, China beat the United States as the top recepient of FDI. It received $129 trillion, up 4% from the previous year. Another $103 trillion went to Hong Kong, up 39%, mostly thanks to financial activity like mergers.
China’s services sector was particularly attractive to investors, especially retail, transportation and finance. A big chunk of that investment came from the likes of South Korea and Europe. Those from Japan and the United States, meanwhile, fell 39% and 21%, respectively.
Hong Kong is in a class of its own. Despite its return to China, its development as a financial centre during its years as a Commonwealth member has seen it grow exponentially. Last year, foreign direct investment rose 39%, with the majority of it in the financial services sector which saw a number of acquisitions.
U.S. and Europe Collapses
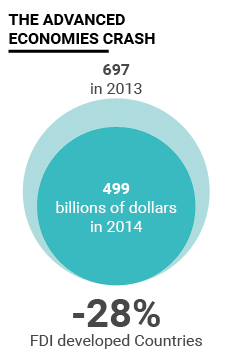
In 2014, FDI contracted for a third year in a row, down 28% from 2013 to $499 billion. It essentially fell in 24 of the 39 most developed economies of the world, starting with Europe, which got 24% of all FDI. It suffered a tumble of 11%.
Only the United Kingdom confirmed itself as one of the most attractive economies in the world, seeing investments rise 32.6% to $72 billion.
Meanwhile, the United States proved to be an exceptional case after it witnessed a huge drop of 60% to $92 billion. One of the reasons for this, according to UNCTAD, was mobile phone services giant Vodafone’s sale of Verizon. This contributed to North America’s share of total FDI shrinking to 12% from 21%.
Developing Economies
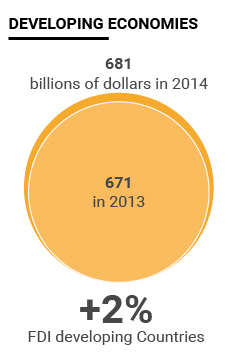
The story is similar for so-called economies in transition, with the case of Russia suffering a 70% drop. Developing countries, meanwhile, keep growing, up 2% to $681 billion in 2014.
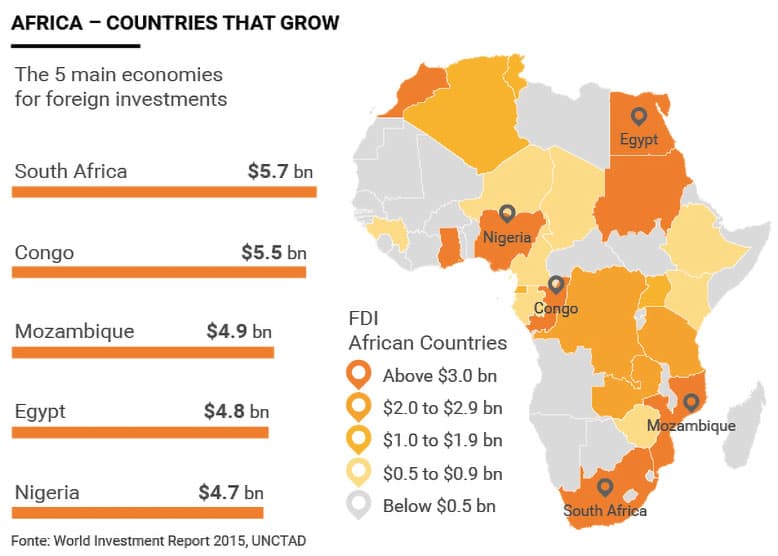
By continent, Asia keeps receiving investments thanks to China; Latin America is losing them; while Africa remains stable at $54 billion even if it varies from region to region. North Africa fell 15% while sub-Saharan countries enjoyed a 5% growth. The biggest recipients of the continent were South Africa at $5.7 billion, Congo with $5.5 billion, Mozambique at $4.9 billion, Egypt $4.8 billion and Nigeria $4.7 billion.
The most significant result among the biggest developing economies is India, which saw FDI grow 22% last year.