
 NYC: the secrets of its famous subway map | New York City subway
 NYC: the secrets of its famous subway map | New York City subway sign
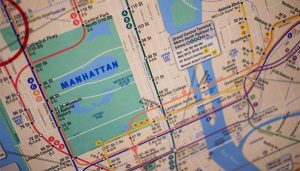
 NYC: the secrets of its famous subway map | Detail of the New York City subway map
 NYC: the secrets of its famous subway map | New York City Subway Station
 NYC: the secrets of its famous subway map | New York City sybway entrance
 NYC: the secrets of its famous subway map | 72nd street subway station
 NYC: the secrets of its famous subway map | Subway Map, New York City
 NYC: the secrets of its famous subway map | Subway station, New York City
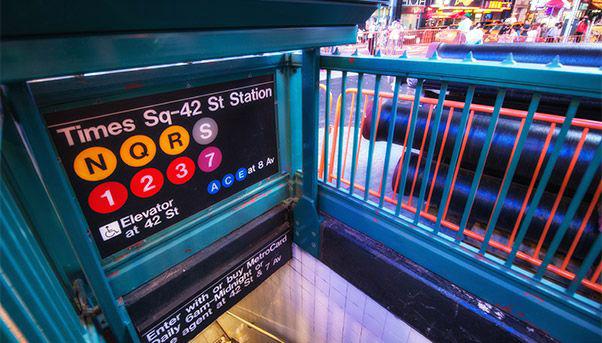 NYC: the secrets of its famous subway map | Times Square, subway station
- IN 1977 THE METROPOLITAN TRANSPORTATION AUTHORITY ASKED A PRESTIGIOUS DESIGN FIRM TO REDO THE NEW YORK CITY SUBWAY MAP
- THE GOAL WAS TO CHANGE THE IMAGE OF THE SUBWAY, MAKING IT EASIER TO USE FOR BOTH NEW YORKERS AND TOURISTS ALIKE
- DESIGNERS, ARTISTS AND PSYCHOLOGISTS WORKED ON THE PROJECT
- COLOURS WERE INTRODUCED, ALONG WITH CHANGES TO LINE ROUTES, AND BOROUGH SHAPES WERE ADAPTED TO MAKE THE MAP EASIER TO READ
- THE NEW MAP WAS ADOPTED IN 1978 AND DIGITIZED IN 1998
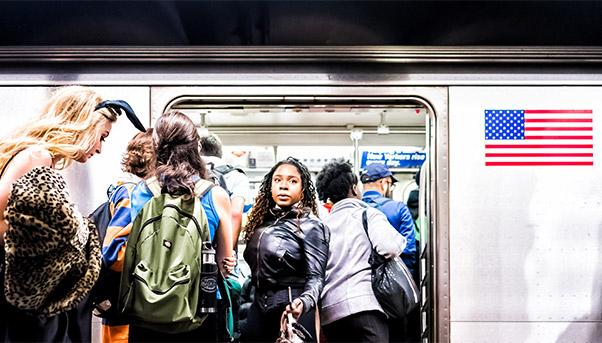
- OVER 5 MILLION PEOPLE USE THE NEW YORK CITY TRASPORTA SUBWAY EACH WORK DAY
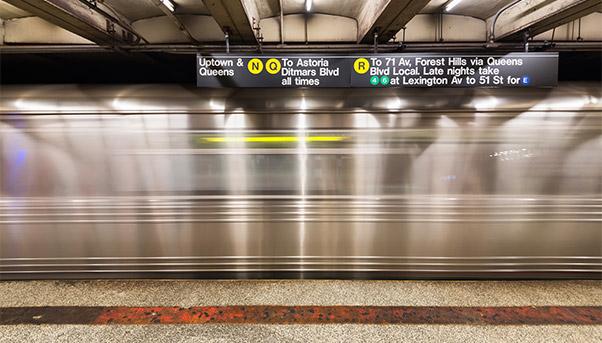
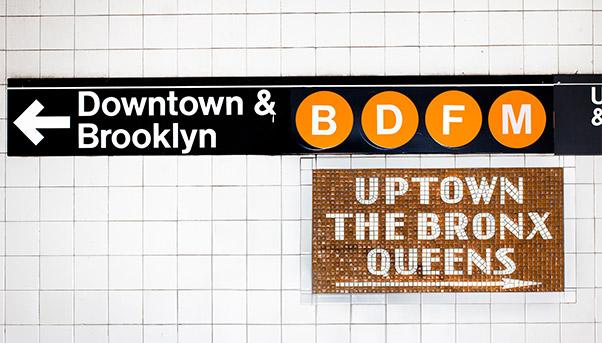
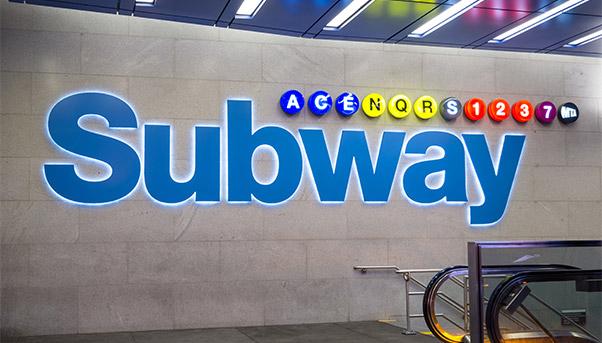
Uptown and the Bronx; Downtown and Brooklyn. Millions of people have found themselves at least once in their lives standing on the platform looking at New York City’s colour-coded subway signs. The green one runs from Wall Street to Harlem and beyond; the yellow runs through Time Square; the orange leads from Manhattan to Queens. These and many other colours make up one of the best-known maps in the world.
This massive infrastructure (245 miles or 394 kilometres of track and over 5 million people transported every week day) has become a icon of the city not only for its functionality, but also because of the image on its map. It tells a story that goes beyond the route taken by the trains.
Because that famous map – which the New York Times has documented in detail – was years in the making. Its creation took into account political, environmental and aesthetic factors, and resulted in a transport guide that was truly user-friendly. This photograph of the subsoil of the Big Apple rewrites reality in such a perfect and orderly way that it can be considered a work of art.
History of the New York subway map: redesign the NYC subway
In the 1970s, New York City was on the verge of bankruptcy; crime was widespread and subway utilization rates were at the lowest levels since 1918, according to the New York Times.
During those difficult years, the Metropolitan Transportation Authority (the New York State agency that manages the transport network in the city and surrounding areas) was receiving thousands of reports from residents who complained how difficult it was to use the subway.
Customers complained about the geographic inaccuracies of the map designed by Massimo Vignelli, according to the MTA’s website. Central Park, for example, was a square rather than a rectangle. They also found it aesthetically confusing because the colour of the water around the island was beige rather than blue.
And so, in 1977 the MTA set up a team led by John Tauranac, assisted by the design firm Michael Hertz Associates, to draw up a new subway map.
The goal was a new subway map that included city features and was easy to read, intuitive and understandable, designed to facilitate the use of the infrastructure not only by residents, but also by tourists.
A 1986 article in the Newsday newspaper quoted Tauranac as saying the previous map «belonged on the walls of the Museum of Modern Art, not on the walls of the subway».
The designer of the New York subway map
For the drafting of the new map, a series of studies were conducted on how people saw the old ones. In particular, the psychologist Arline Bronzaft discovered that many users were disoriented by the straight lines of the tracks depicted in old design, when it was clear from their subway rides that many of the routes were curved.
Nobuyuki Siraisi, a well-known sculptor and painter, made an important contribution with an unconventional method. The artist traveled the journey of each train with his eyes closed, perceiving the curves made by the train with his body, and drew them one by one in his sketch book.
The new curved tracks designed by Siraisi followed the movements perceived by travelers, restoring a sense of truth to the experience of the journey taken.
In addition to this, the artist assigned a color to each line, so that they were easily recognizable. The map designers used nature’s real colors for the topographical elements of the city like lakes and parks.
The routes shared by several lines, such as the Downtown-Uptown route completed by lines 4, 5 and 6, were merged into a single graphic “trunk” depicted in a single color, to avoid overlapping and confusion on the map.
Furthermore, designers made the subway map help guide people on their surface pedestrian paths as well. Another member of the team, the designer Susan Shaw, made sure the city could also be navigated through the map by including, say, the ponds of Central Park.
Redesigning the geography of New York City
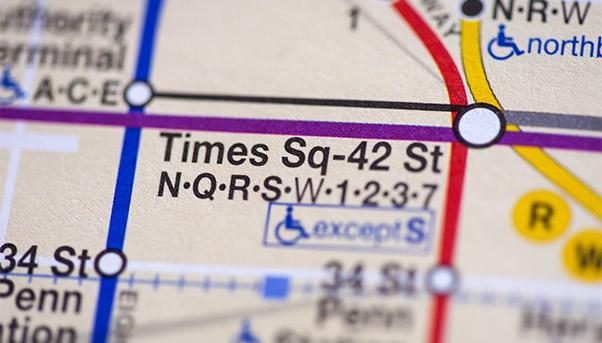
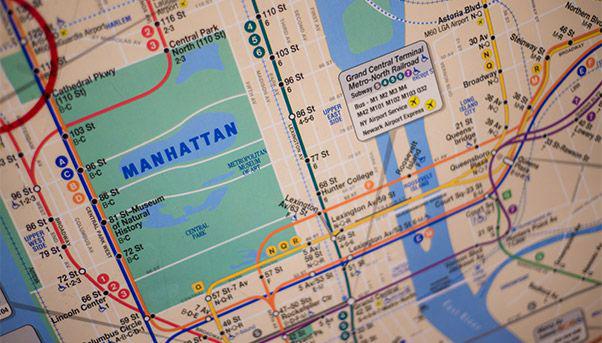
The New York subway map radically reshapes the five boroughs of New York City. Their shape, their proportions, their size, as shown on the map, do not correspond to reality. Because of the high density of its subway lines, the shapes of Lower Manhattan and Downtown Brooklyn have been distorted to facilitate navigation and reading of routes.
Particular attention should be paid to Staten Island, one of the five boroughs, which has a railway line but no subway. Its railway line was included on the map in 1998 in order to provide users with a complete image of the city transport network.
The success of the new map
The new map produced by the Hertz agency was officially adopted in 1978. It was digitized in 1998. Today’s version is an evolution, and contains many tricks to make its understandable, such as the use of 20 different font styles ranging in size, line spacing, and weight, each of them used for a specific purpose.
The effort made to create a new way of explaining such a strategic infrastructure for the city has paid off over time. The colors and the geography of the places makes the map today – after more than 40 years – still one of the most symbolic photographs of New York City.